

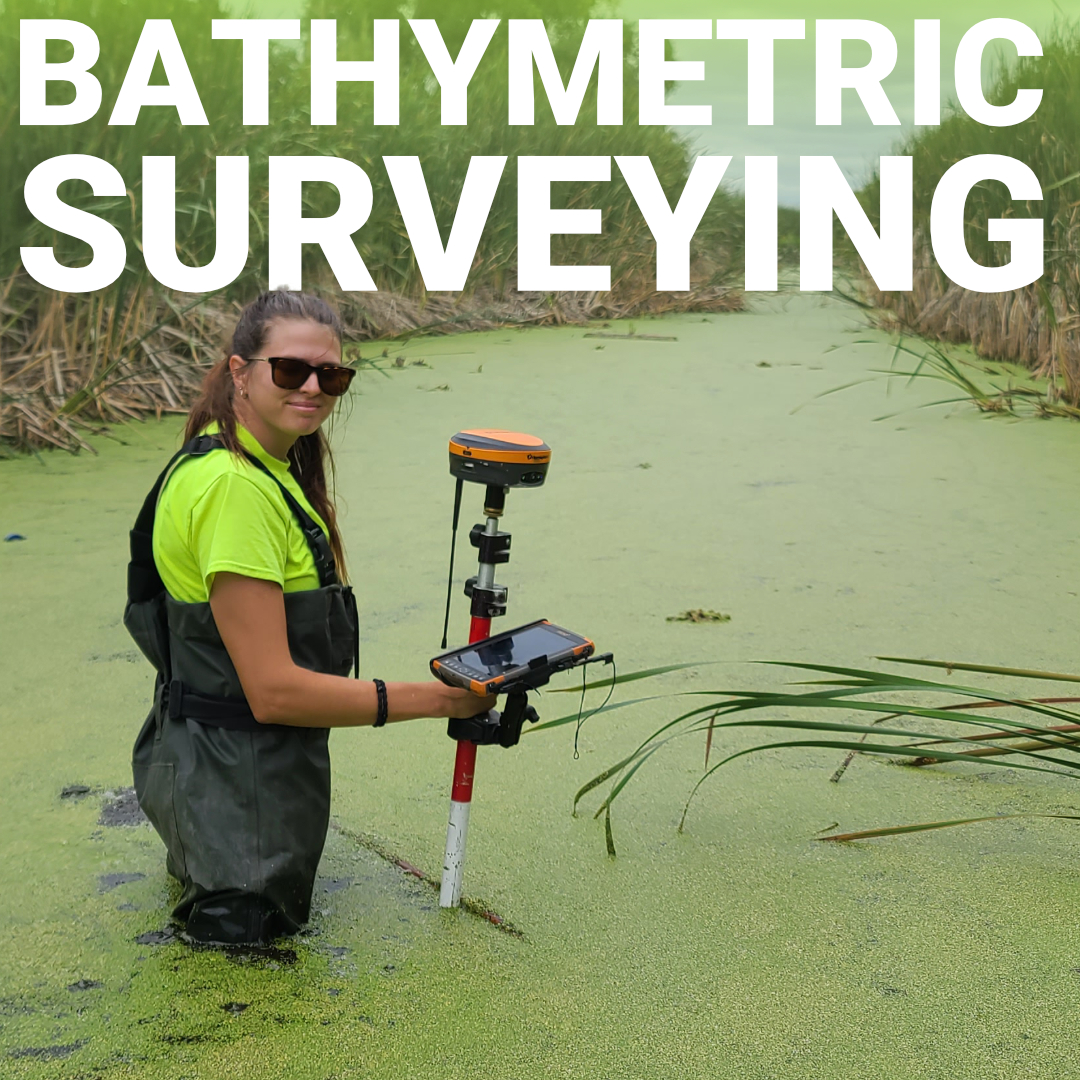
Most people picture surveying as someone standing behind a total station on dry land, but some of the most technically demanding survey work happens where the ground disappears entirely: beneath rivers, lakes, harbors, and coastal waterways. Bathymetric surveying is the discipline that maps what you can’t see: the shape, depth, and contour of underwater terrain. And unlike land-based survey work, where you can walk the site and visually assess conditions, everything here is inferred from sound. That makes equipment selection, GNSS accuracy, and methodology all critical in ways that even experienced surveyors sometimes underestimate.
What Bathymetric Surveying Actually Measures
The Role of GNSS in Bathymetric Work
Key Applications Across U.S. Industries
Equipment Setup and Integration Considerations
The term comes from the Greek bathos (depth) and metron (measure), and that’s exactly what it does. It produces a three-dimensional model of the floor of a body of water. The output looks a lot like a topographic map, with contour lines and elevation models, except the “elevation” is expressed as depth below the water surface.
This data drives real engineering and safety decisions: whether a harbor channel is deep enough for a vessel class, whether a bridge foundation has adequate underwater clearance, how much sediment has accumulated since the last dredge cycle. Hydrographic surveyors working in the U.S. frequently operate under standards set by the National Oceanic and Atmospheric Administration (NOAA) or the U.S. Army Corps of Engineers, both of which have specific accuracy requirements depending on the project type.
Bathymetric surveys are a family of methods, each suited to different site conditions, required accuracies, and project budgets. The four most commonly used approaches in North American practice are:
A transducer mounted to a boat emits a single acoustic pulse directly downward and measures the travel time to the bottom and back. It produces a depth profile along the vessel’s track line. Best for smaller water bodies, narrow channels, or projects where full-coverage density isn’t required.
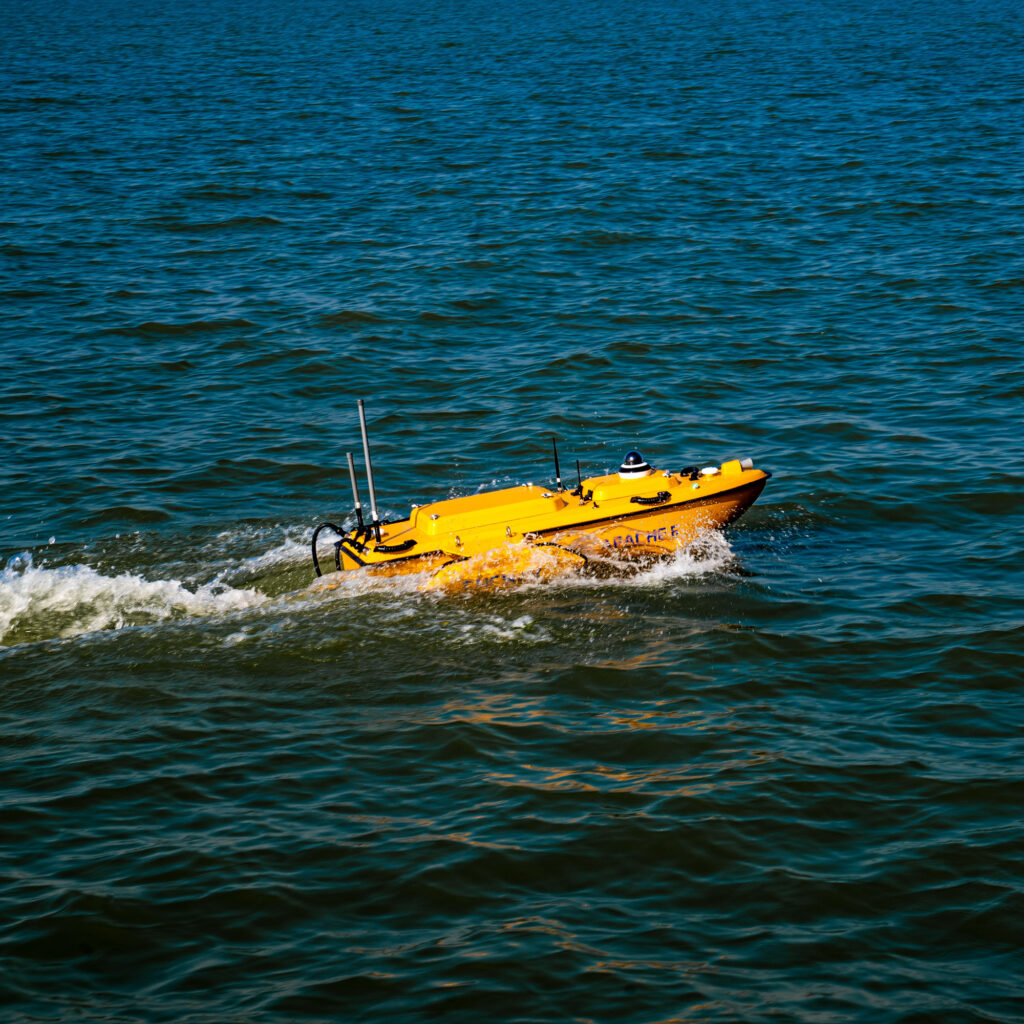
Instead of a single downward beam, multi-beam systems fan out dozens to hundreds of simultaneous beams across a wide swath of the bottom. The result is near-complete bottom coverage in a single pass. This is the preferred method for harbor surveys, dredging projects, and any work where a detailed 3D model of the floor is needed.
Lower-frequency sound waves penetrate the sediment layer and reflect back from harder substrata below. This reveals what’s under the floor, not just the floor itself, useful for pipeline routing, foundation assessments, and environmental studies of sediment layering.
Rather than measuring depth directly, ADCP systems use the Doppler shift of reflected sound waves to measure water velocity at different depths. They’re used when current characterization is part of the deliverable, such as in flood modeling or tidal studies.
One of the most important, and often least discussed, aspects of bathymetric surveying is positional accuracy. Every depth reading is only as useful as the coordinate it’s tied to. If your GNSS solution is drifting or producing degraded fixes, your depth model will show it as horizontal smearing or systematic offsets in your contour lines.
This is where RTK GNSS becomes essential. Unlike post-processed approaches, RTK delivers centimeter-level positioning in real time, which means the vessel’s position is accurate at the exact moment each depth reading is recorded. For multi-beam surveys in particular, where swath widths can reach 10 times the water depth, any positional uncertainty compounds across the full coverage area.
At Bench-Mark, we regularly support surveyors working in exactly this kind of environment. The Hemisphere S631, our primary RTK system, is well-suited to marine and near-shore applications where reliable multi-constellation tracking and stable fix quality matter. Tight phase center calibration and consistent fix performance across GNSS constellations make a measurable difference in the quality of the final depth model.
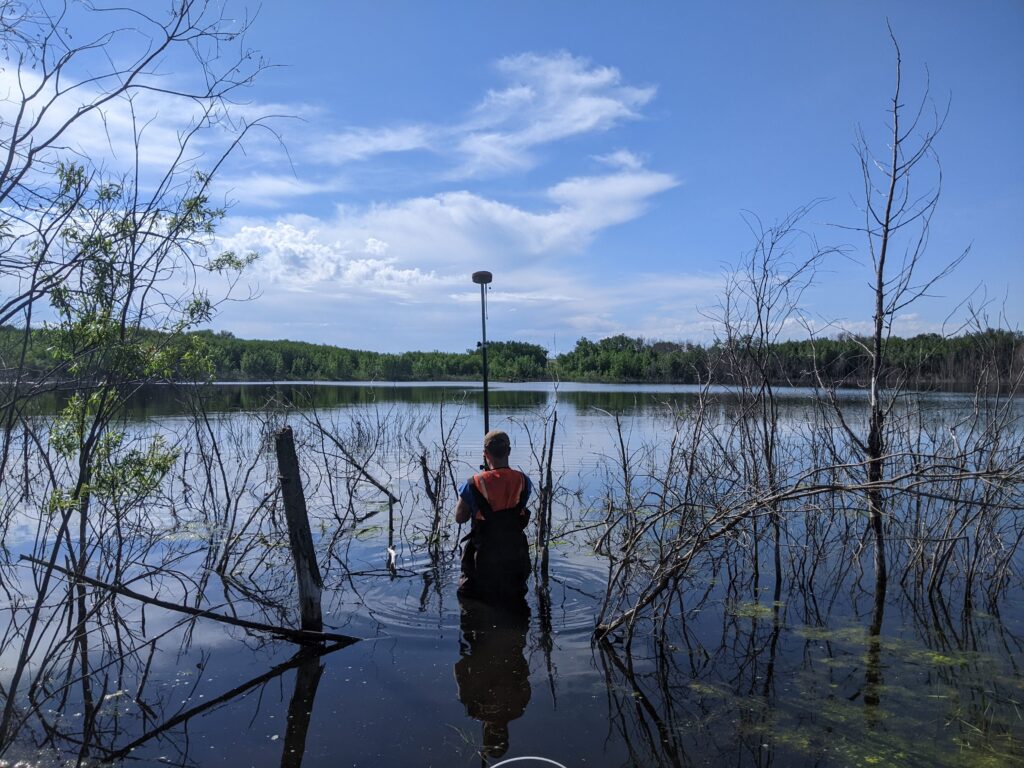
Bathymetric data feeds into a broader range of industries than most people outside the profession realize:
The acoustic sensor is the center of a bathymetric system, but it doesn’t operate in isolation. A complete setup typically integrates several components: the sonar transducer, a GNSS receiver for positioning, a motion reference unit (MRU) to compensate for vessel pitch and roll, and a data acquisition system that time-stamps and merges all the incoming streams.
Getting these components to work together accurately requires attention to a few specific factors. Sound velocity in water varies with temperature, salinity, and pressure, a sound velocity profile (SVP) cast at the start of a survey corrects for this variation and should be repeated whenever conditions change. Motion compensation is equally important: even on relatively calm inland water, vessel movement introduces depth errors that must be removed in post-processing or corrected in real time with a quality MRU.
For teams new to hydrographic work, Bench-Mark is one of the few North American dealers that supports equipment configuration and technical questions remotely, which matters when you’re troubleshooting a vessel-mounted setup from a dock in a different state.
The deliverables from a bathymetric survey depend on the project, but typically include depth contour maps, digital elevation models (DEMs) of the water body floor, and hydrographic reports that document methodology and accuracy. For dredging contracts, volume calculations derived from comparing pre- and post-dredge surveys are standard. For infrastructure projects, the DEM becomes a direct input to the engineering design model.
Processing software varies widely, but common platforms include HYPACK, QPS Qimera, and ESRI-based GIS tools for final deliverable production. Field data collection is typically handled through dedicated hydrographic acquisition software, though in simpler single-beam setups, some surveyors integrate collection directly with their existing field data collectors.
The difference between a functional bathymetric survey and one that actually supports the decisions downstream comes down to the same things that matter on land: accurate positioning, well-calibrated equipment, and a clear understanding of what accuracy the project actually requires. Sound travels where light doesn’t, but the discipline and rigor of survey-grade work still applies, maybe more so, because you can’t walk back over the water to check a questionable reading. Equip the job correctly from the start, and the depth model you produce will hold up to scrutiny long after you’ve left the shore.
